The median private school in Mexico runs at 46% of capacity (98 Enrollment X-Rays)
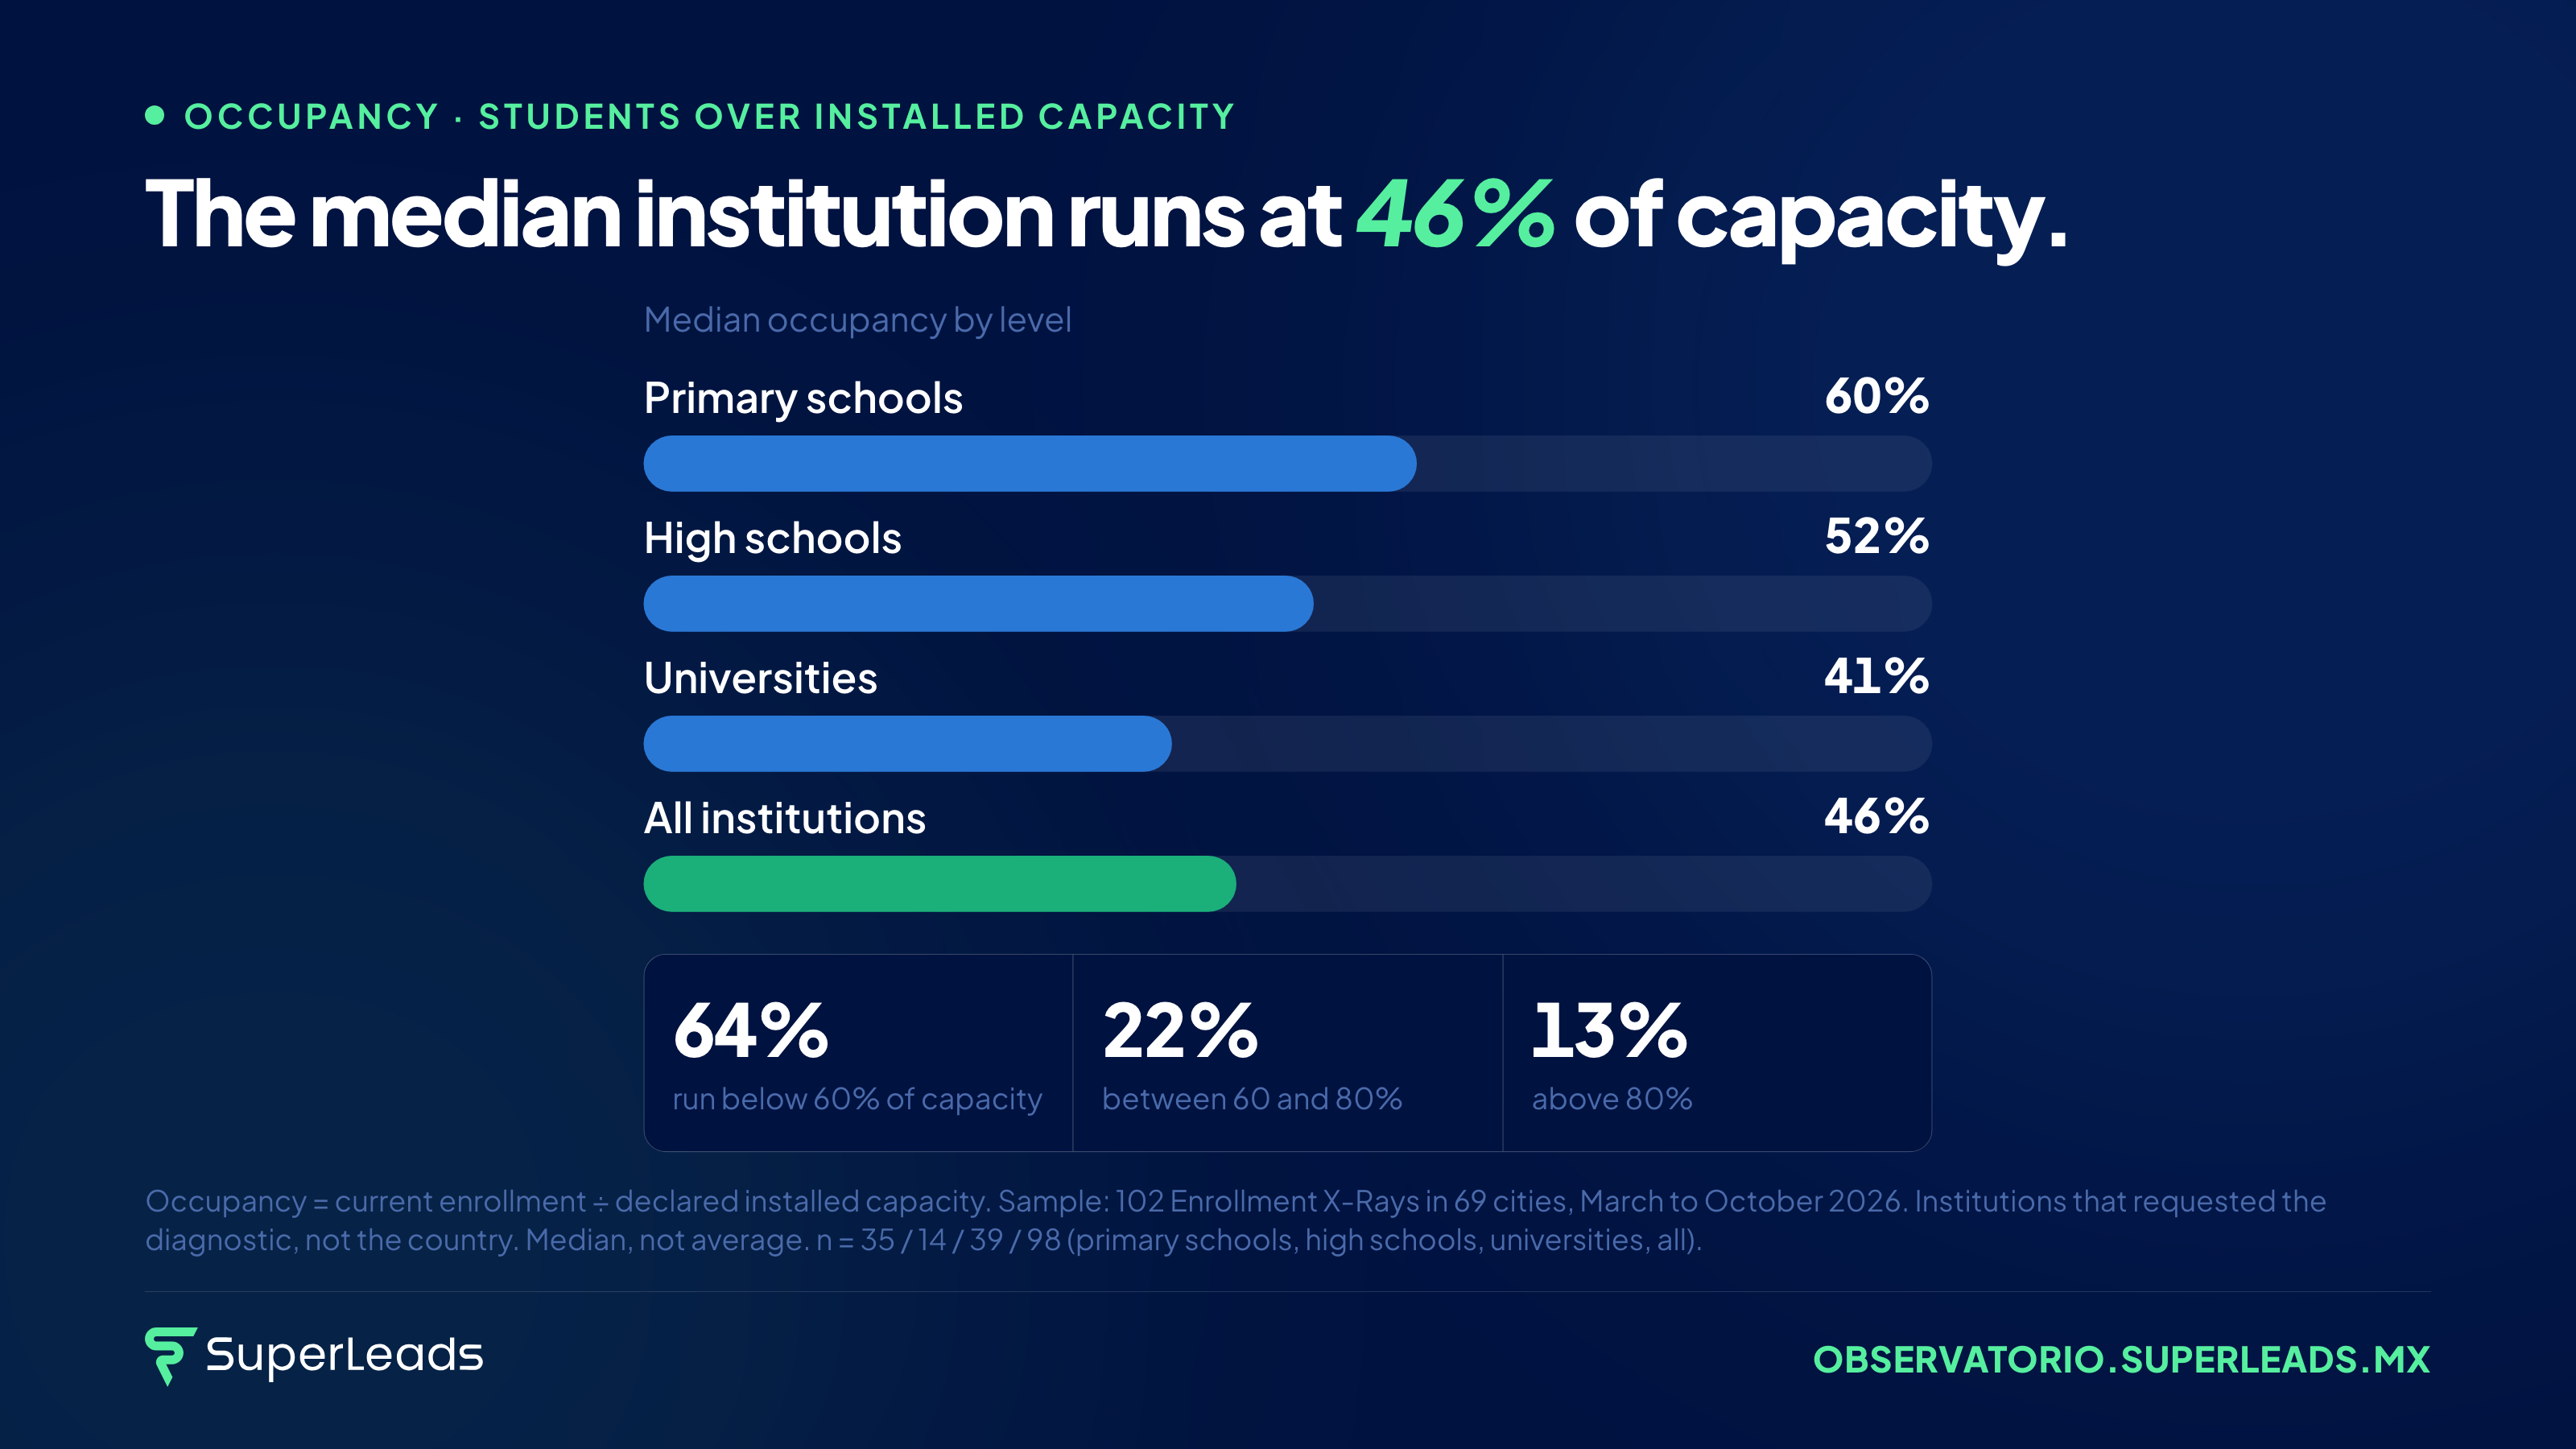
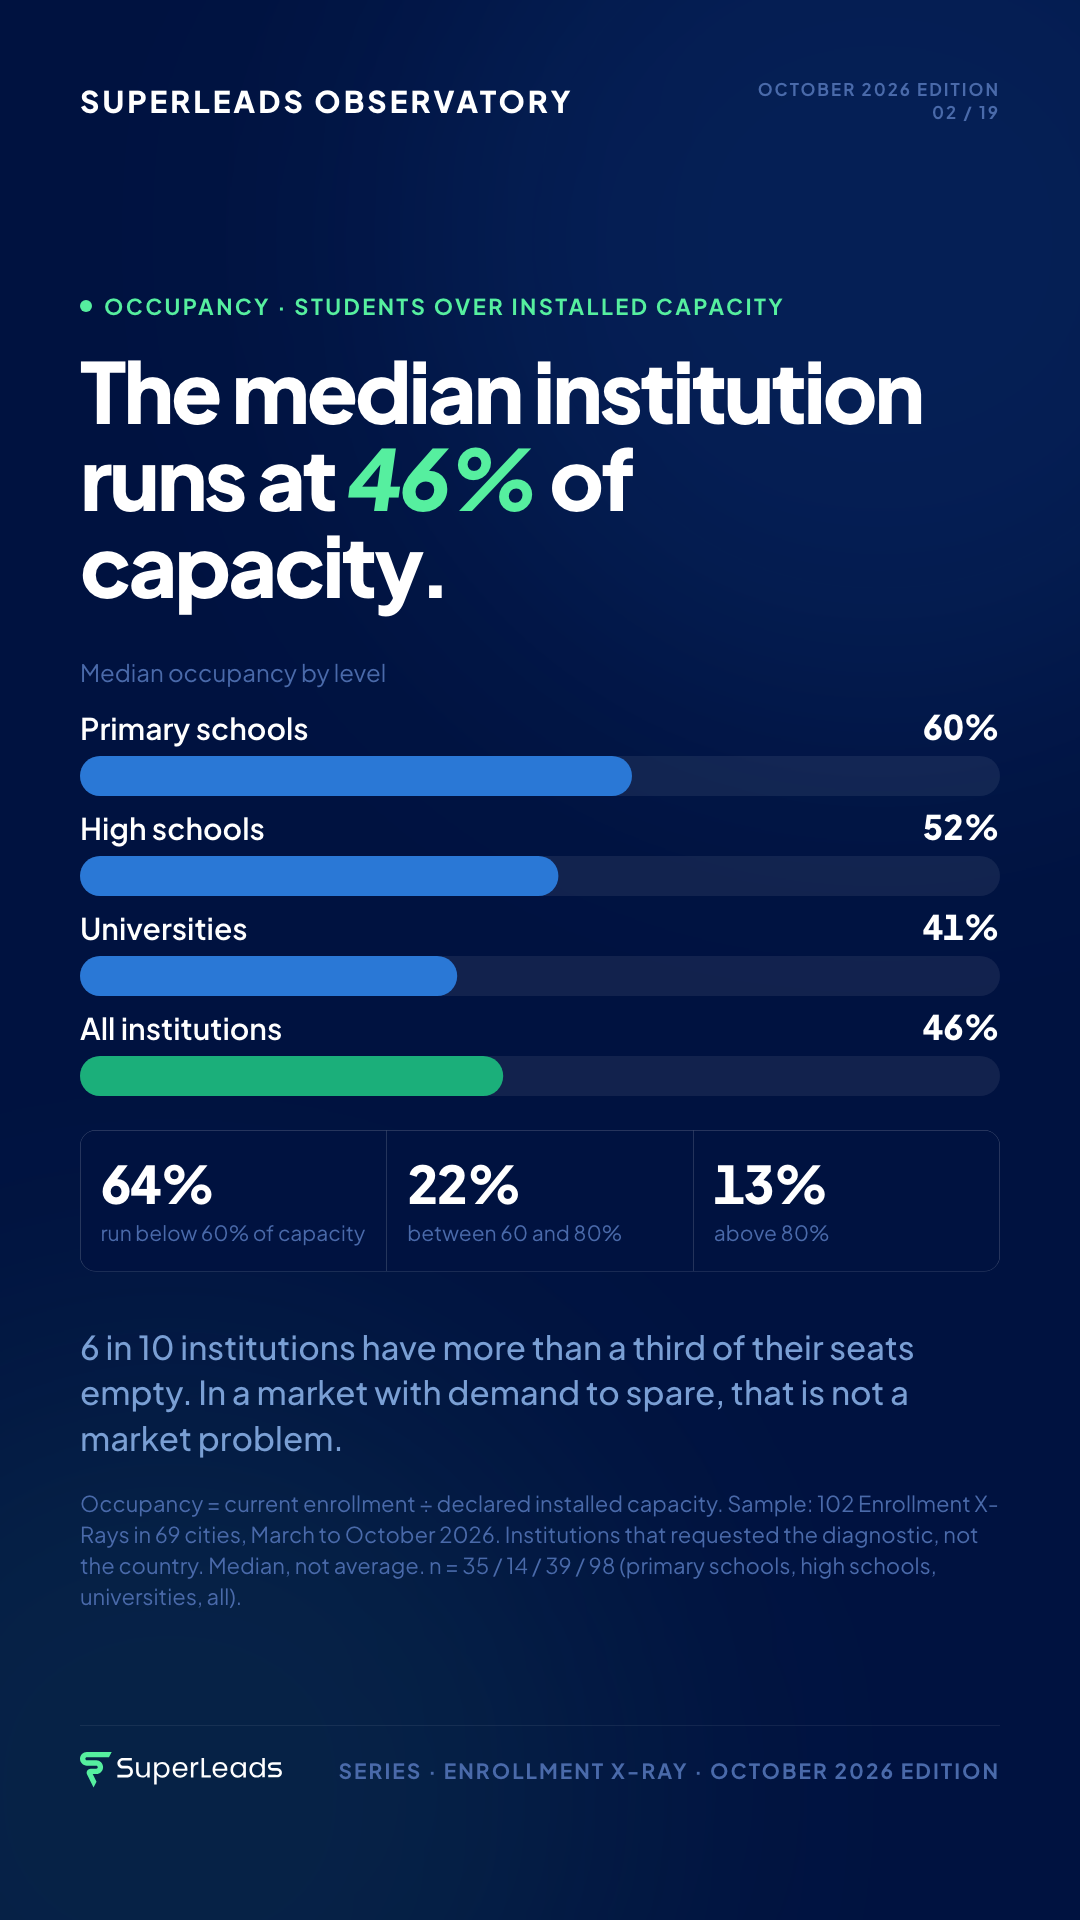
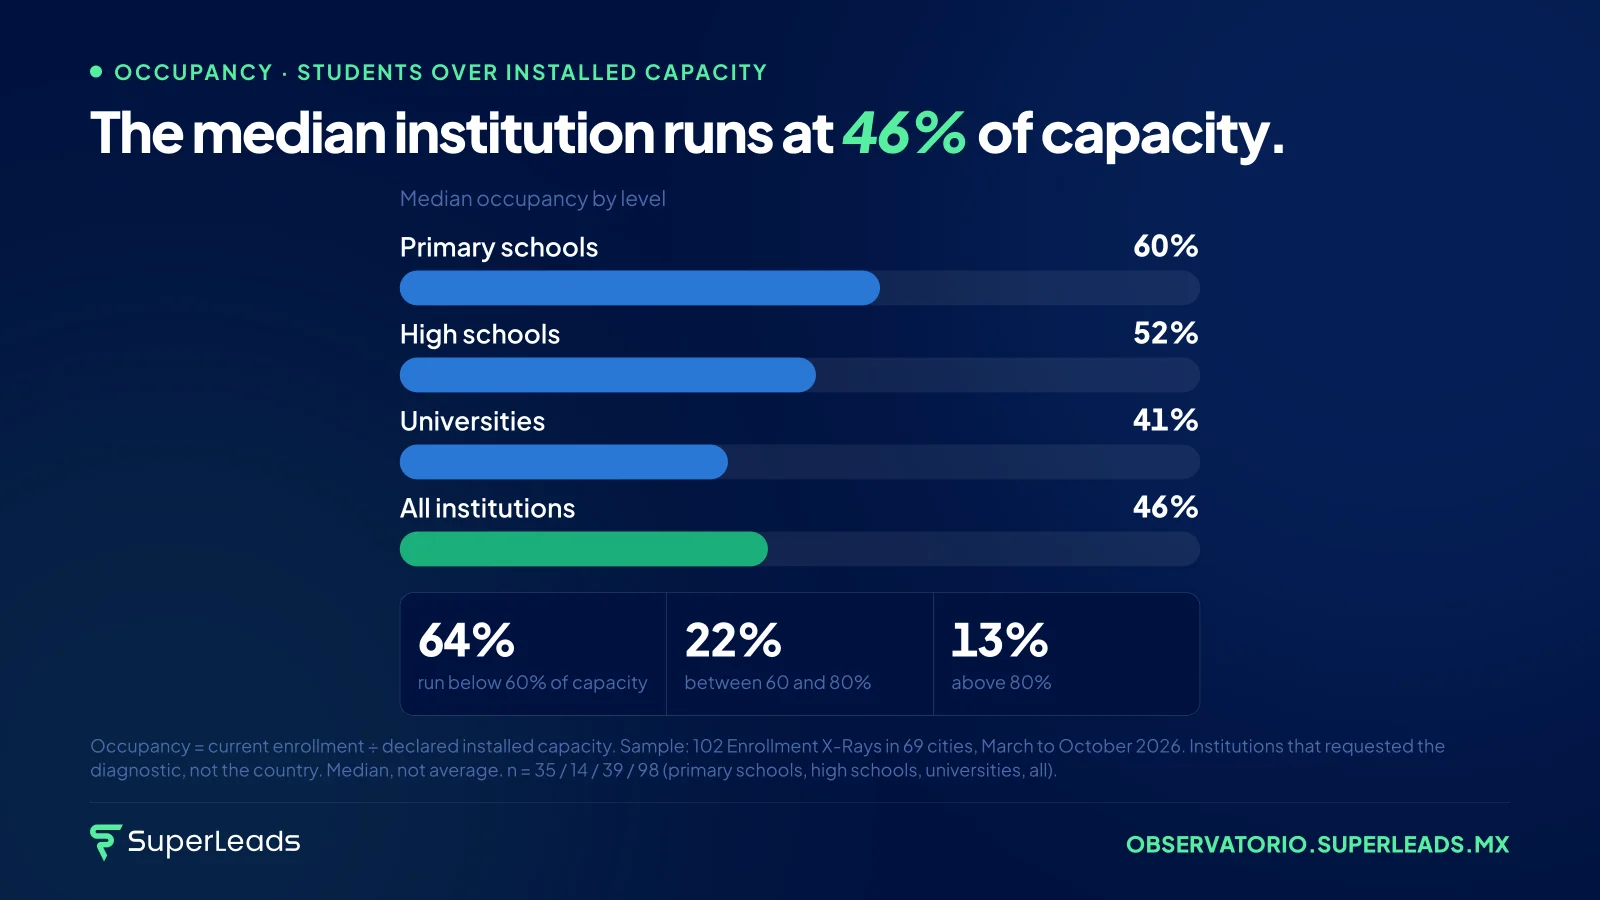
Median occupancy in the October 2026 edition: primary schools 60%, high schools 52%, universities 41%. All together: 46%. 64% run below 60% and only 13% above 80%.
A school with open seats in a market with demand to spare does not have a market problem. It has a process problem. The family does show up; what decides the school year is what happens in the hours after its first message.
What percentage of your capacity is filled today? If you are below 60%, you are with the majority. The question is whether you want to stay there.
The table behind the chart
Median occupancy by level
| Item | Value |
|---|---|
| Primary schools | 60% |
| High schools | 52% |
| Universities | 41% |
| All institutions | 46% |
| Figure | What it is |
|---|---|
| 64% | run below 60% of capacity |
| 22% | between 60 and 80% |
| 13% | above 80% |
Where it comes from
Occupancy = current enrollment ÷ declared installed capacity. Sample: 102 Enrollment X-Rays completed between March and October 2026 with owners and directors of 102 private institutions in 69 Mexican cities. These are institutions that requested the diagnostic, not the country. Median, not average: one school with 7,000 students skews the average and makes it lie. n = 35 / 14 / 39 / 98 (primary schools, high schools, universities, all).
Median before average; no figure based on fewer than 5 institutions is published. Full methodology.
For your stories and status updates
The same chart in vertical format, animated, 8 seconds long. Download it and post it as is to WhatsApp Status, Instagram Stories or TikTok — the source is already on it.
This data point airs as a YouTube Short (in Spanish) on November 3 at 7:30 p.m. Mexico City time. See the series playlist
Put it in your story or blog
Copy this code and paste it into your site: the chart shows in full and the source travels with it.
<iframe src="https://observatorio.superleads.mx/en/data/median-occupancy-rate/embed/" width="100%" style="aspect-ratio:16/10.4;border:0;max-width:960px" loading="lazy" title="The median institution runs at 46% of capacity. · SuperLeads Observatory"></iframe>