
Private schools in Mexico, from the inside.
Between March and October 2026 we ran 102 Enrollment X-Rays with owners and directors of private institutions in 69 cities. This is the edition: no names, with n, median before average, broken down by level. It is republished every six months.
One data point per question
Each with chart, table, citation and social-ready version.
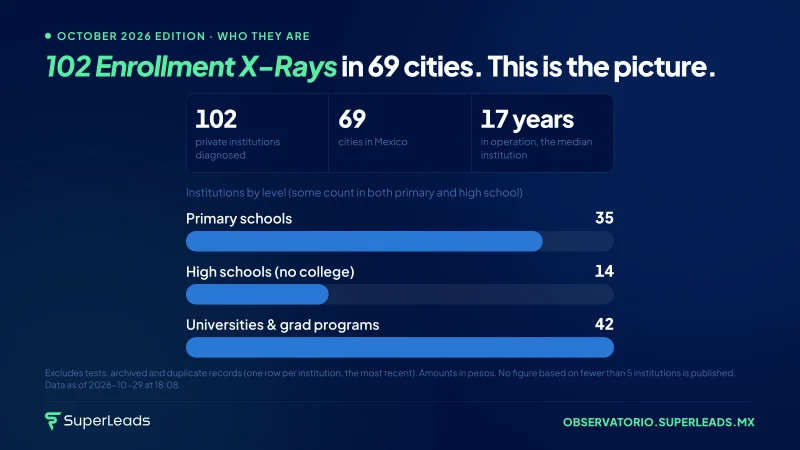
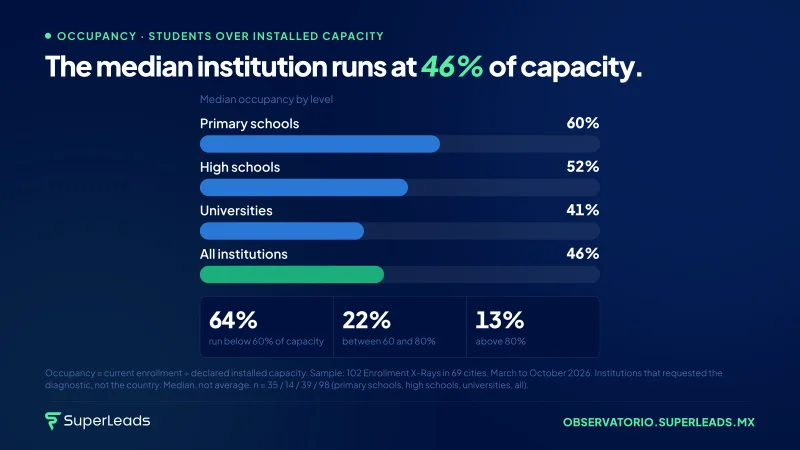
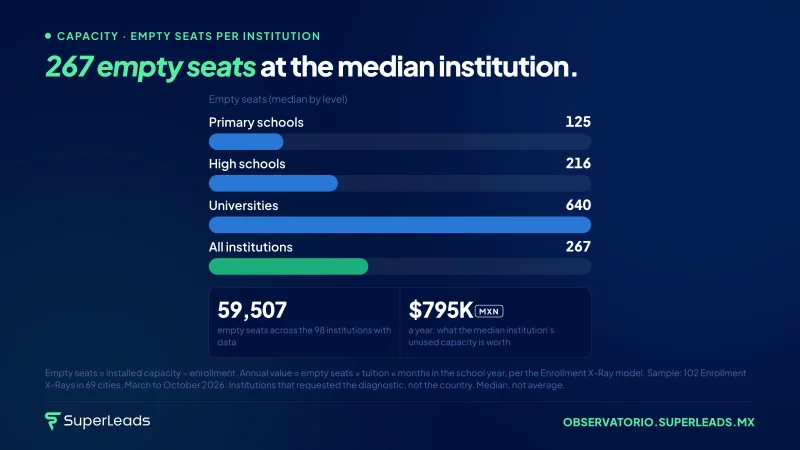
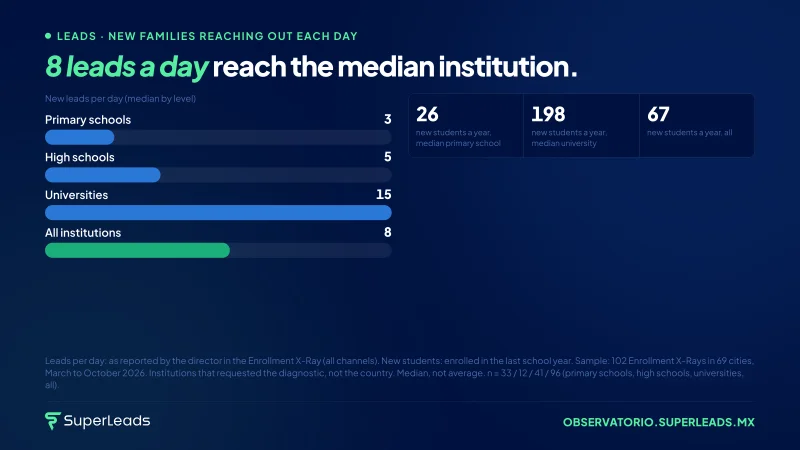
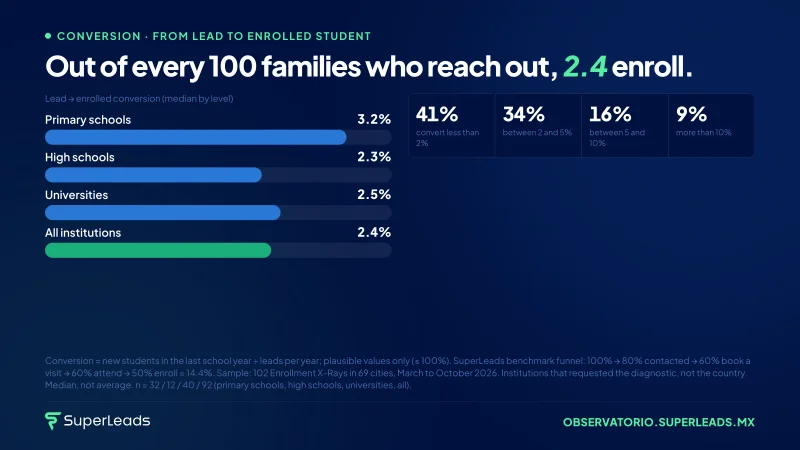
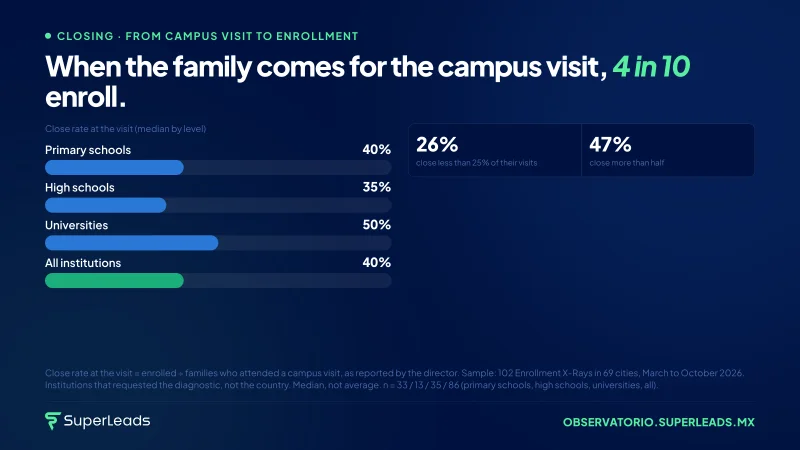
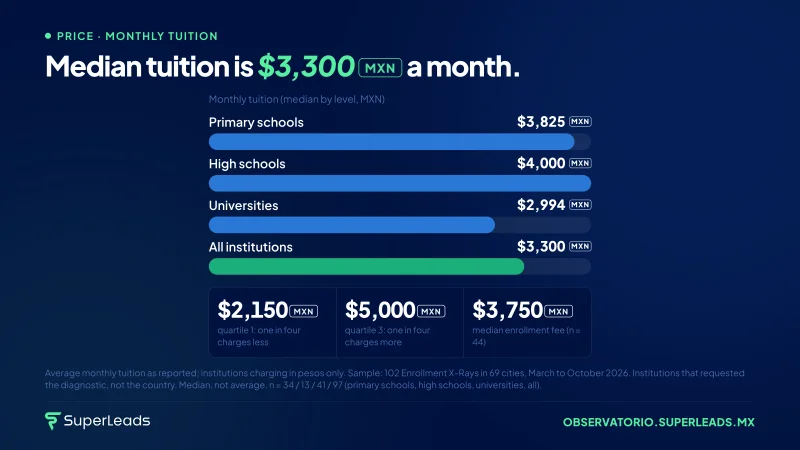
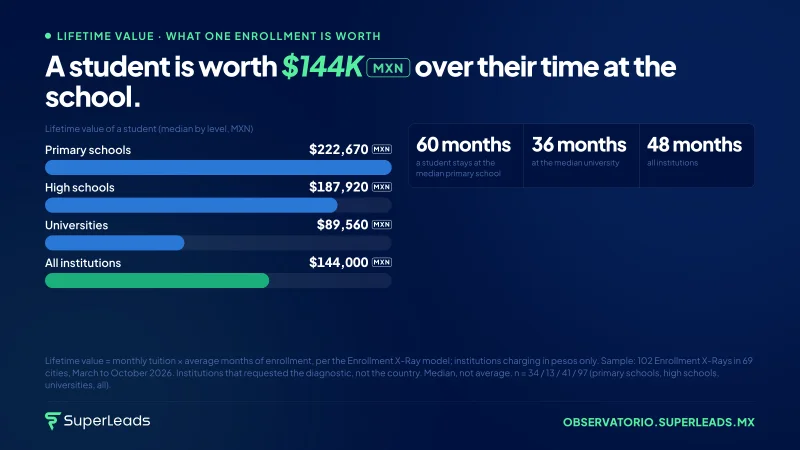
Median by level
The typical school at each level, in a single table. Amounts in Mexican pesos.
| Median | All n = 102 | Primary schools n = 35 | High schools n = 14 | Universities n = 42 |
|---|---|---|---|---|
| Occupancy | 46.2% | 60% | 51.6% | 40.8% |
| Empty seats | 267 | 125 | 216 | 640 |
| New leads per day | 8 | 3 | 5 | 15 |
| Lead-to-enrollment conversion | 2.4% | 3.2% | 2.3% | 2.5% |
| Close rate at the visit | 40% | 40% | 35% | 50% |
| Monthly tuition | $3,300MXN | $3,825MXN | $4,000MXN | $2,994MXN |
| Student lifetime value | $144,000MXN | $222,670MXN | $187,920MXN | $89,560MXN |
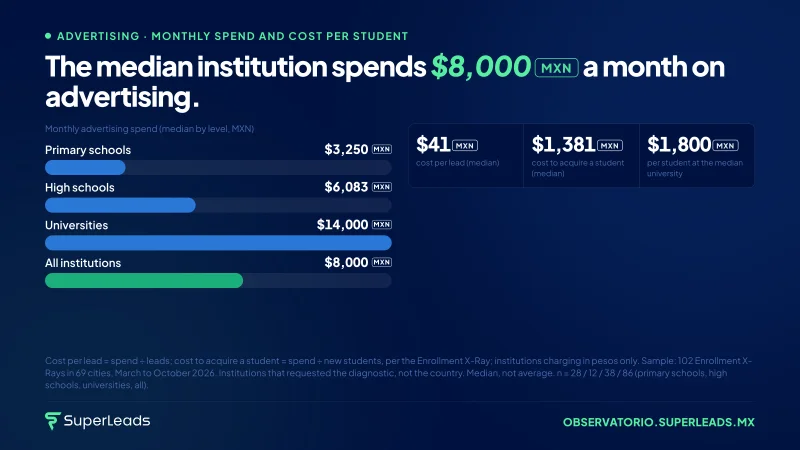
| Monthly advertising spend | $8,000MXN | $3,250MXN | $6,083MXN | $14,000MXN |
| Cost per lead | $41MXN | $50MXN | $42MXN | $43MXN |
| Cost to acquire a student | $1,381MXN | $1,200MXN | $1,162MXN | $1,800MXN |
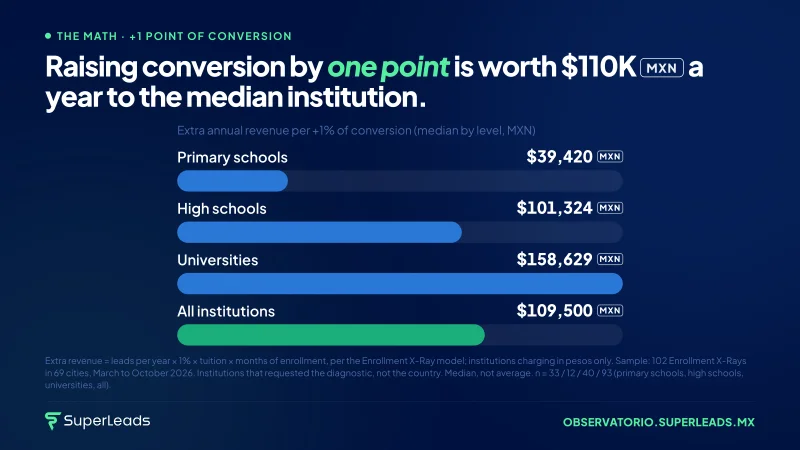
| Extra revenue from +1 point of conversion (per year) | $109,500MXN | $39,420MXN | $101,324MXN | $158,629MXN |
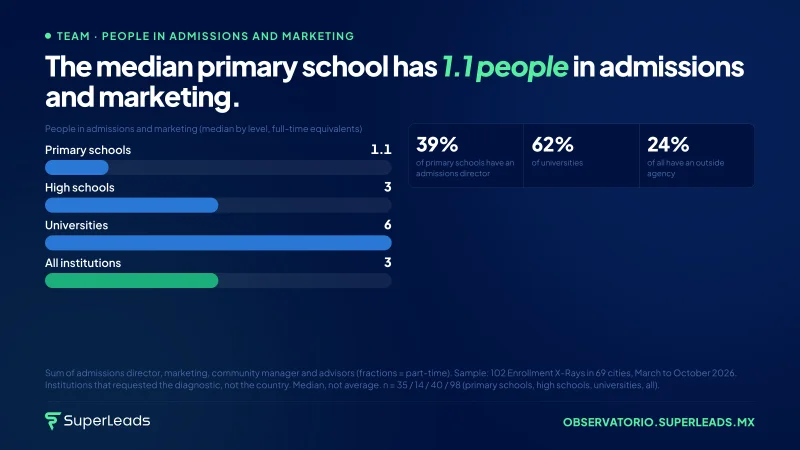
| People in admissions and marketing | 3 | 1.1 | 3 | 6 |
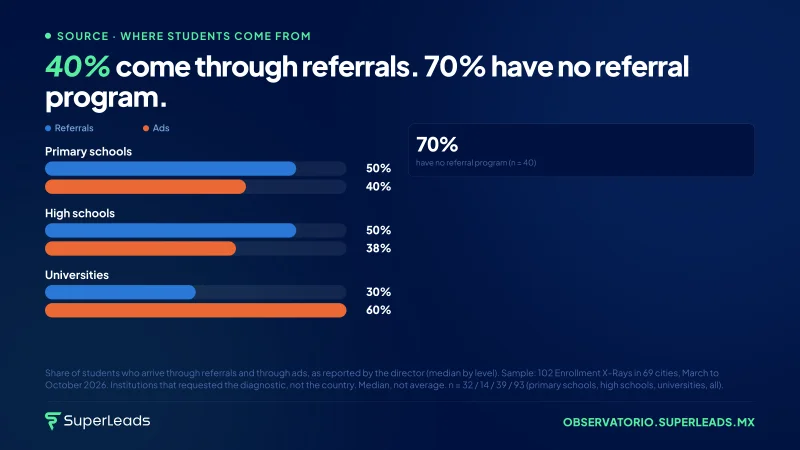
| Arrive by referral | 40% | 50% | 50% | 30% |
| Years in operation | 17 | 21 | 28 | 18 |
Every indicator, by group
Median, quartiles and n for every indicator. What directors believe (reasons, how they rate their own marketing) is presented as belief, not measurement.
All institutions · n = 102
The bar shows where the middle half of institutions sits (Q1 to Q3) and the line marks the median. Same axis for all four groups.
| Indicator | Median | Q1 – Q3 (the middle half) | n |
|---|---|---|---|
| Size and occupancy | |||
| Occupancy Current enrollment ÷ reported installed capacity. | 46.2% | 21.4% – 66.8% | 98 |
| Enrollment Students enrolled today. | 200 | 68 – 800 | 98 |
| Installed capacity Students the institution can hold, according to the director. | 600 | 218 – 1,500 | 98 |
| Empty seats Installed capacity − enrollment. | 267 | 100 – 715 | 98 |
| Demand and conversion | |||
| New leads per day Families or applicants who inquire, across all channels, as reported by the director. | 8 | 3.1 – 25 | 96 |
| New students last cycle New enrollments in the most recent cycle. | 67 | 25 – 300 | 95 |
| Lead-to-enrollment conversion New students last cycle ÷ leads per year (values ≤ 100% only). | 2.4% | 1.4% – 5.0% | 92 |
| Close rate at the visit Enrollments ÷ families who attended a visit, according to the director. | 40% | 21.5% – 65% | 86 |
| Money | |||
| Retention Average months a student stays, according to the director. | 48 months | 24 months – 60 months | 100 |
| Monthly tuition Reported average monthly tuition; peso-denominated institutions only. | $3,300MXN | $2,150 MXN – $5,000 MXN | 97 |
| Enrollment fee Reported enrollment fee; peso-denominated institutions only. | $3,750MXN | $2,050 MXN – $10,665 MXN | 44 |
| Student lifetime value Monthly tuition × months of retention, per the Enrollment X-Ray model. | $144,000MXN | $60,400 MXN – $254,995 MXN | 97 |
| Annual value of unused capacity Empty seats × tuition × months in the school year, per the Enrollment X-Ray model. | $794,625MXN | $313,312 MXN – $2,542,036 MXN | 92 |
| Extra revenue from +1 point of conversion (per year) Leads per year × 1% × tuition × months of retention, per the Enrollment X-Ray model. | $109,500MXN | $38,325 MXN – $259,712 MXN | 93 |
| Advertising and team | |||
| Monthly advertising spend Reported monthly spending on ads. | $8,000MXN | $3,000 MXN – $26,250 MXN | 86 |
| Cost per lead Advertising spend ÷ leads. | $41MXN | $20 MXN – $76 MXN | 86 |
| Cost to acquire a student Advertising spend ÷ new students. | $1,381MXN | $659 MXN – $3,331 MXN | 84 |
| Arrive by referral Share of students who arrive through referrals, according to the director. | 40% | 15% – 62.5% | 93 |
| Arrive through ads Share of students who arrive through ads, according to the director. | 50% | 20% – 80% | 93 |
| People in admissions and marketing Admissions director + marketing + community manager + advisors (fractions = part-time). | 3 | 1 – 6 | 98 |
| Admissions advisors People who handle leads. | 1 | 0 – 3 | 94 |
| Scholarships and institution | |||
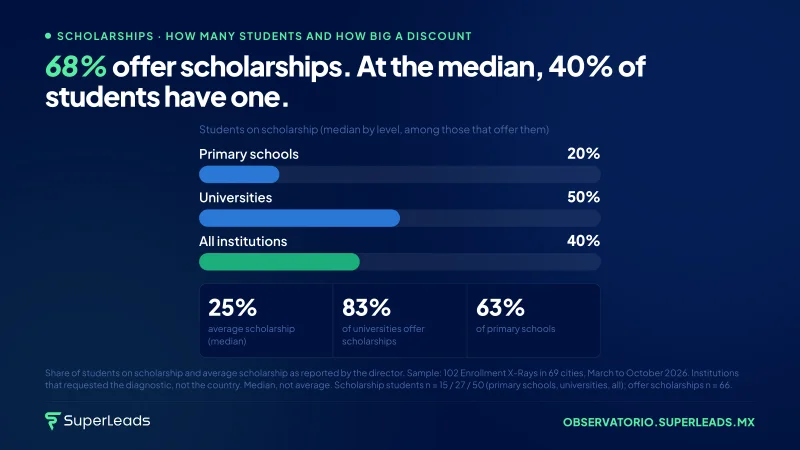
| Students on scholarship Share of students on scholarship, among institutions that offer them. | 40% | 10% – 95% | 50 |
| Average scholarship Average scholarship discount. | 25% | 20% – 35% | 51 |
| Years in operation Age of the institution. | 17 | 8 – 30 | 90 |
| Campuses Number of campuses. | 1 | 1 – 2 | 74 |
Who does what
How they are distributed
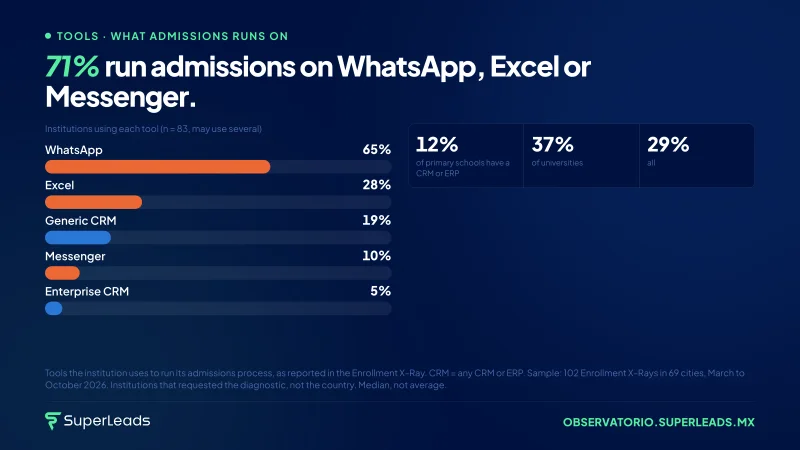
What they run admissions on
n = 83 institutions that answered
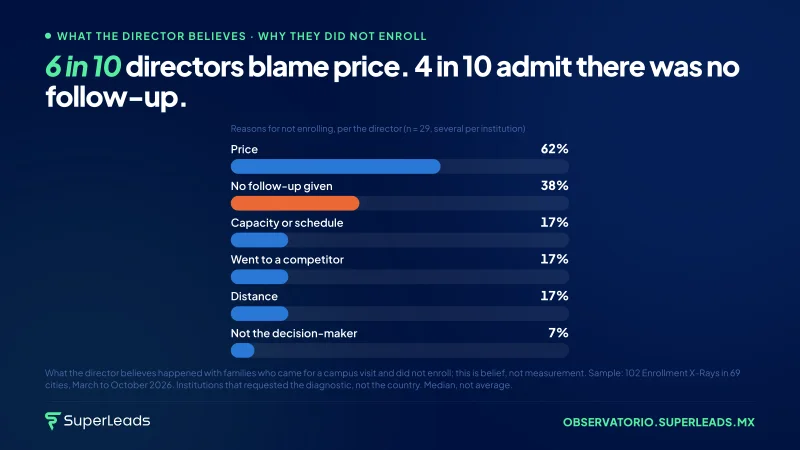
Why they think families didn’t enroll (director’s belief)
n = 29 institutions that answered
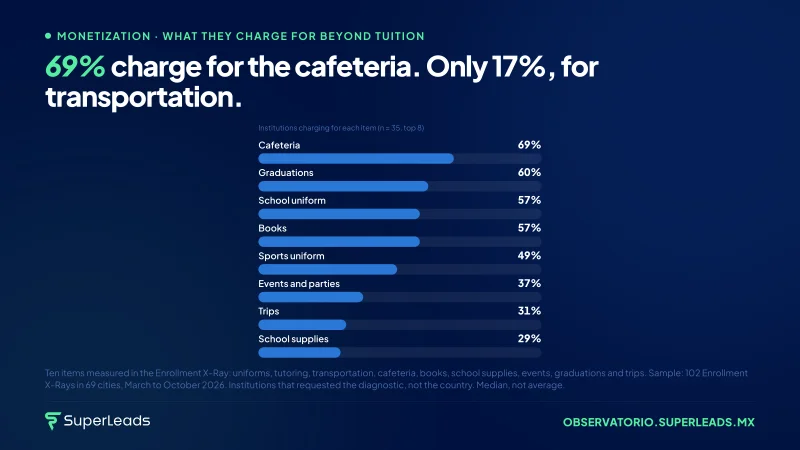
What they charge for beyond tuition
n = 35 institutions that answered
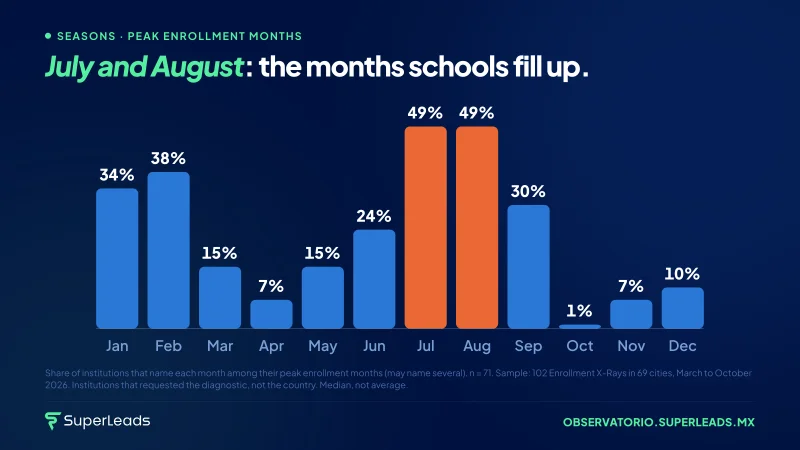
Peak enrollment months (more than one allowed)
n = 71 institutions that answered
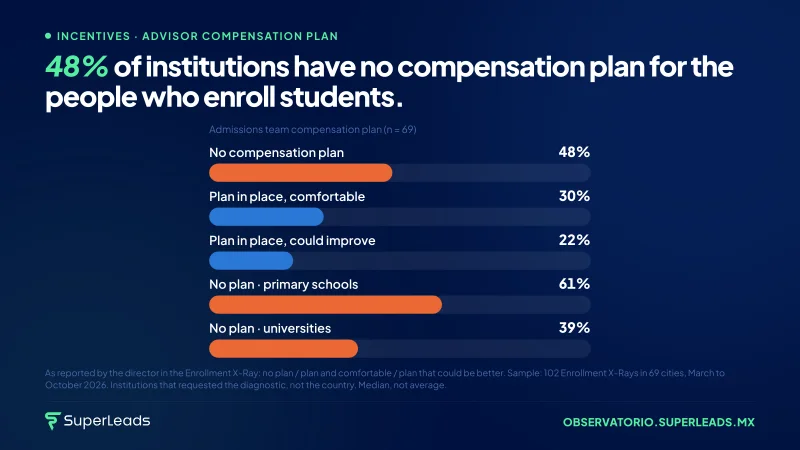
Compensation plan for advisors
n = 69 institutions that answered
Occupancy as reported by the director
n = 69 institutions that answered
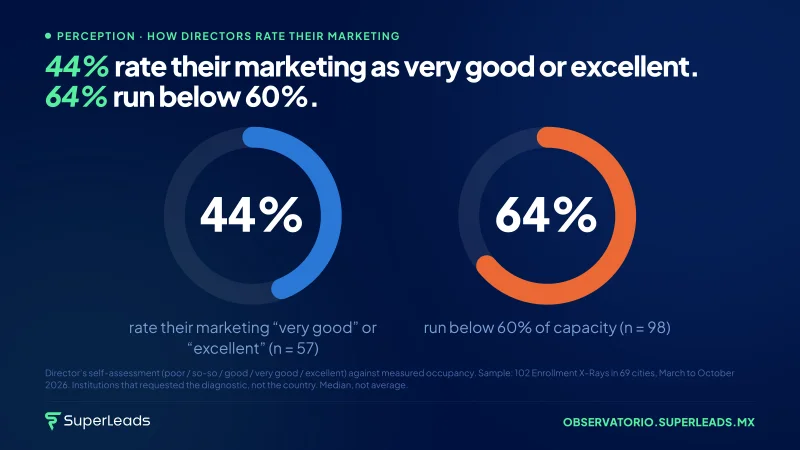
How they rate their own marketing (belief)
n = 57 institutions that answered
How they rate their closing hook (belief)
n = 51 institutions that answered
Referral program
n = 40 institutions that answered
Primary schools (no higher education) · n = 35
The bar shows where the middle half of institutions sits (Q1 to Q3) and the line marks the median. Same axis for all four groups.
| Indicator | Median | Q1 – Q3 (the middle half) | n |
|---|---|---|---|
| Size and occupancy | |||
| Occupancy Current enrollment ÷ reported installed capacity. | 60% | 31.2% – 75% | 35 |
| Enrollment Students enrolled today. | 170 | 96 – 303 | 35 |
| Installed capacity Students the institution can hold, according to the director. | 330 | 200 – 700 | 35 |
| Empty seats Installed capacity − enrollment. | 125 | 80 – 254 | 35 |
| Demand and conversion | |||
| New leads per day Families or applicants who inquire, across all channels, as reported by the director. | 3 | 1.2 – 9 | 33 |
| New students last cycle New enrollments in the most recent cycle. | 26 | 18 – 57 | 34 |
| Lead-to-enrollment conversion New students last cycle ÷ leads per year (values ≤ 100% only). | 3.2% | 1.6% – 6.4% | 32 |
| Close rate at the visit Enrollments ÷ families who attended a visit, according to the director. | 40% | 20% – 70% | 33 |
| Money | |||
| Retention Average months a student stays, according to the director. | 60 months | 48 months – 72 months | 35 |
| Monthly tuition Reported average monthly tuition; peso-denominated institutions only. | $3,825MXN | $2,675 MXN – $5,490 MXN | 34 |
| Enrollment fee Reported enrollment fee; peso-denominated institutions only. | $4,000MXN | $2,400 MXN – $26,000 MXN | 15 |
| Student lifetime value Monthly tuition × months of retention, per the Enrollment X-Ray model. | $222,670MXN | $158,475 MXN – $334,905 MXN | 34 |
| Annual value of unused capacity Empty seats × tuition × months in the school year, per the Enrollment X-Ray model. | $553,410MXN | $228,825 MXN – $903,670 MXN | 33 |
| Extra revenue from +1 point of conversion (per year) Leads per year × 1% × tuition × months of retention, per the Enrollment X-Ray model. | $39,420MXN | $13,797 MXN – $107,036 MXN | 33 |
| Advertising and team | |||
| Monthly advertising spend Reported monthly spending on ads. | $3,250MXN | $2,000 MXN – $9,500 MXN | 28 |
| Cost per lead Advertising spend ÷ leads. | $50MXN | $20 MXN – $94 MXN | 28 |
| Cost to acquire a student Advertising spend ÷ new students. | $1,200MXN | $810 MXN – $2,337 MXN | 28 |
| Arrive by referral Share of students who arrive through referrals, according to the director. | 50% | 30% – 78.8% | 32 |
| Arrive through ads Share of students who arrive through ads, according to the director. | 40% | 20% – 60% | 32 |
| People in admissions and marketing Admissions director + marketing + community manager + advisors (fractions = part-time). | 1.1 | 0.8 – 3 | 35 |
| Admissions advisors People who handle leads. | 0 | 0 – 1.2 | 34 |
| Scholarships and institution | |||
| Students on scholarship Share of students on scholarship, among institutions that offer them. | 20% | 10% – 37% | 15 |
| Average scholarship Average scholarship discount. | 20% | 10% – 30% | 17 |
| Years in operation Age of the institution. | 21 | 8 – 35 | 32 |
| Campuses Number of campuses. | 1 | 1 – 1 | 27 |
Who does what
How they are distributed
What they run admissions on
n = 26 institutions that answered
Why they think families didn’t enroll (director’s belief)
n = 6 institutions that answered
What they charge for beyond tuition
n = 15 institutions that answered
Peak enrollment months (more than one allowed)
n = 24 institutions that answered
Compensation plan for advisors
n = 23 institutions that answered
Occupancy as reported by the director
n = 23 institutions that answered
How they rate their own marketing (belief)
n = 17 institutions that answered
How they rate their closing hook (belief)
n = 17 institutions that answered
Referral program
n = 15 institutions that answered
High schools (no higher education) · n = 14
The bar shows where the middle half of institutions sits (Q1 to Q3) and the line marks the median. Same axis for all four groups.
| Indicator | Median | Q1 – Q3 (the middle half) | n |
|---|---|---|---|
| Size and occupancy | |||
| Occupancy Current enrollment ÷ reported installed capacity. | 51.6% | 26.3% – 84% | 14 |
| Enrollment Students enrolled today. | 250 | 134 – 1,289 | 14 |
| Installed capacity Students the institution can hold, according to the director. | 800 | 280 – 1,394 | 14 |
| Empty seats Installed capacity − enrollment. | 216 | 100 – 550 | 14 |
| Demand and conversion | |||
| New leads per day Families or applicants who inquire, across all channels, as reported by the director. | 5 | 2.2 – 14.2 | 12 |
| New students last cycle New enrollments in the most recent cycle. | 54 | 19 – 248 | 13 |
| Lead-to-enrollment conversion New students last cycle ÷ leads per year (values ≤ 100% only). | 2.3% | 1.5% – 5.0% | 12 |
| Close rate at the visit Enrollments ÷ families who attended a visit, according to the director. | 35% | 20% – 75% | 13 |
| Money | |||
| Retention Average months a student stays, according to the director. | 60 months | 45 months – 60 months | 14 |
| Monthly tuition Reported average monthly tuition; peso-denominated institutions only. | $4,000MXN | $2,350 MXN – $7,490 MXN | 13 |
| Student lifetime value Monthly tuition × months of retention, per the Enrollment X-Ray model. | $187,920MXN | $123,300 MXN – $433,860 MXN | 13 |
| Annual value of unused capacity Empty seats × tuition × months in the school year, per the Enrollment X-Ray model. | $686,000MXN | $331,750 MXN – $3,294,040 MXN | 13 |
| Extra revenue from +1 point of conversion (per year) Leads per year × 1% × tuition × months of retention, per the Enrollment X-Ray model. | $101,324MXN | $27,498 MXN – $259,032 MXN | 12 |
| Advertising and team | |||
| Monthly advertising spend Reported monthly spending on ads. | $6,083MXN | $1,400 MXN – $18,000 MXN | 12 |
| Cost per lead Advertising spend ÷ leads. | $42MXN | $8 MXN – $99 MXN | 12 |
| Cost to acquire a student Advertising spend ÷ new students. | $1,162MXN | $320 MXN – $3,484 MXN | 12 |
| Arrive by referral Share of students who arrive through referrals, according to the director. | 50% | 33.8% – 78.8% | 14 |
| Arrive through ads Share of students who arrive through ads, according to the director. | 37.5% | 13.8% – 53.8% | 14 |
| People in admissions and marketing Admissions director + marketing + community manager + advisors (fractions = part-time). | 3 | 1 – 4.2 | 14 |
| Admissions advisors People who handle leads. | 0.9 | 0 – 2 | 14 |
| Scholarships and institution | |||
| Years in operation Age of the institution. | 28 | 8 – 43 | 14 |
| Campuses Number of campuses. | 1 | 1 – 2 | 9 |
Who does what
How they are distributed
What they run admissions on
n = 9 institutions that answered
Peak enrollment months (more than one allowed)
n = 8 institutions that answered
Compensation plan for advisors
n = 7 institutions that answered
Occupancy as reported by the director
n = 8 institutions that answered
Universities and graduate schools · n = 42
The bar shows where the middle half of institutions sits (Q1 to Q3) and the line marks the median. Same axis for all four groups.
| Indicator | Median | Q1 – Q3 (the middle half) | n |
|---|---|---|---|
| Size and occupancy | |||
| Occupancy Current enrollment ÷ reported installed capacity. | 40.8% | 18.2% – 62.5% | 39 |
| Enrollment Students enrolled today. | 490 | 105 – 955 | 39 |
| Installed capacity Students the institution can hold, according to the director. | 1,100 | 700 – 2,000 | 39 |
| Empty seats Installed capacity − enrollment. | 640 | 310 – 1,045 | 39 |
| Demand and conversion | |||
| New leads per day Families or applicants who inquire, across all channels, as reported by the director. | 15 | 6.4 – 42.5 | 41 |
| New students last cycle New enrollments in the most recent cycle. | 198 | 60 – 431 | 40 |
| Lead-to-enrollment conversion New students last cycle ÷ leads per year (values ≤ 100% only). | 2.5% | 1.5% – 4.5% | 40 |
| Close rate at the visit Enrollments ÷ families who attended a visit, according to the director. | 50% | 30% – 60% | 35 |
| Money | |||
| Retention Average months a student stays, according to the director. | 36 months | 34 months – 48 months | 42 |
| Monthly tuition Reported average monthly tuition; peso-denominated institutions only. | $2,994MXN | $1,850 MXN – $6,250 MXN | 41 |
| Enrollment fee Reported enrollment fee; peso-denominated institutions only. | $3,500MXN | $2,050 MXN – $12,090 MXN | 20 |
| Student lifetime value Monthly tuition × months of retention, per the Enrollment X-Ray model. | $89,560MXN | $59,700 MXN – $203,000 MXN | 41 |
| Annual value of unused capacity Empty seats × tuition × months in the school year, per the Enrollment X-Ray model. | $1,513,991MXN | $819,785 MXN – $3,637,500 MXN | 37 |
| Extra revenue from +1 point of conversion (per year) Leads per year × 1% × tuition × months of retention, per the Enrollment X-Ray model. | $158,629MXN | $72,447 MXN – $420,161 MXN | 40 |
| Advertising and team | |||
| Monthly advertising spend Reported monthly spending on ads. | $14,000MXN | $5,000 MXN – $50,000 MXN | 38 |
| Cost per lead Advertising spend ÷ leads. | $43MXN | $24 MXN – $66 MXN | 38 |
| Cost to acquire a student Advertising spend ÷ new students. | $1,800MXN | $480 MXN – $3,077 MXN | 37 |
| Arrive by referral Share of students who arrive through referrals, according to the director. | 30% | 10% – 60% | 39 |
| Arrive through ads Share of students who arrive through ads, according to the director. | 60% | 20% – 90% | 39 |
| People in admissions and marketing Admissions director + marketing + community manager + advisors (fractions = part-time). | 6 | 3 – 7.8 | 40 |
| Admissions advisors People who handle leads. | 3 | 1 – 5.8 | 40 |
| Scholarships and institution | |||
| Students on scholarship Share of students on scholarship, among institutions that offer them. | 50% | 20% – 95% | 27 |
| Average scholarship Average scholarship discount. | 30% | 20% – 40% | 26 |
| Years in operation Age of the institution. | 18 | 10 – 32 | 35 |
| Campuses Number of campuses. | 1 | 1 – 3 | 30 |
Who does what
How they are distributed
What they run admissions on
n = 35 institutions that answered
Why they think families didn’t enroll (director’s belief)
n = 15 institutions that answered
What they charge for beyond tuition
n = 14 institutions that answered
Peak enrollment months (more than one allowed)
n = 30 institutions that answered
Compensation plan for advisors
n = 33 institutions that answered
Occupancy as reported by the director
n = 28 institutions that answered
How they rate their own marketing (belief)
n = 24 institutions that answered
How they rate their closing hook (belief)
n = 24 institutions that answered
Referral program
n = 16 institutions that answered
Use it freely, with attribution
Enrollment X-Ray, October 2026 edition: private education in Mexico, by the numbers, SuperLeads Observatory (https://observatorio.superleads.mx/en/enrollment-x-ray/).
SuperLeads. (2026, October 30). Enrollment X-Ray, October 2026 edition: private education in Mexico, by the numbers. SuperLeads Observatory on Admissions and Private Education. https://observatorio.superleads.mx/en/enrollment-x-ray/
@misc{superleads2026enenrollmentxr,
  author = {{SuperLeads}},
  title = {Enrollment X-Ray, October 2026 edition: private education in Mexico, by the numbers},
  year = {2026},
  month = oct,
  howpublished = {SuperLeads Observatory on Admissions and Private Education},
  publisher = {SuperLeads},
  url = {https://observatorio.superleads.mx/en/enrollment-x-ray/},
  note = {License CC BY 4.0}
}<a href="https://observatorio.superleads.mx/en/enrollment-x-ray/">Enrollment X-Ray, October 2026 edition: private education in Mexico, by the numbers</a> — Source: <a href="https://observatorio.superleads.mx/en/">SuperLeads Observatory</a>.
License CC BY 4.0: use it, publish it and adapt it, even commercially, with attribution. How to cite
Four things before you cite
- It’s our sample, not the country: institutions that requested a diagnostic.
- The median is the school in the middle; a single 7,000-student school can move the average.
- A K-12 school counts in both primary and high school; universities are separate.
- No figure based on fewer than 5 institutions is published.